|
COMETS EARTH JUPITER KUIPER BELT MARS MERCURY METEORITES NEPTUNE OORT CLOUD PLUTO SATURN SOLAR SYSTEM SPACE SUN URANUS VENUS ORDER PRINTS
PHOTO CATEGORIES SCIENCEVIEWS AMERICAN INDIAN AMPHIBIANS BIRDS BUGS FINE ART FOSSILS THE ISLANDS HISTORICAL PHOTOS MAMMALS OTHER PARKS PLANTS RELIGIOUS REPTILES SCIENCEVIEWS PRINTS
|
Related Documents
Download Options
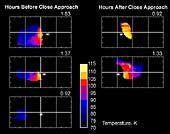
A montage of maps of Saturn's moon Phoebe shows surface temperatures at various times of day as determined by the composite infrared spectrometer onboard Cassini during the June 11, 2004, Phoebe flyby. The asterisk on each map shows the location of the subsolar point, where the Sun is directly overhead. This point moves across the surface as Phoebe rotates. It is morning in regions to the left of the subsolar point, and afternoon in regions to the right. Like a newspaper weather map, different colors indicate different temperatures, though Phoebe's temperatures are distinctly cooler than even the coldest January day on Earth. Equatorial temperatures peak in the early afternoon near 112 Kelvin (-257 Fahrenheit), plunging to 78 Kelvin (-319 Fahrenheit) before dawn, and are even colder at higher latitudes. The large day/night temperature contrasts imply that Phoebe's surface is covered in loose dust or ice particles that store little heat and thus cool off rapidly at night. Regions of Phoebe's surface that were not observed are shown in black. Most of the maps show the effect on surface temperatures of the large crater-like depression seen in Cassini's visible-wavelength images of Phoebe, which is located just left of center in these maps. Crater walls that are shadowed and cold in the early morning in the first map are sunlit and warm in the late afternoon in the final map. |
