|
COMETS EARTH JUPITER KUIPER BELT MARS MERCURY METEORITES NEPTUNE OORT CLOUD PLUTO SATURN SOLAR SYSTEM SPACE SUN URANUS VENUS ORDER PRINTS
PHOTO CATEGORIES SCIENCEVIEWS AMERICAN INDIAN AMPHIBIANS BIRDS BUGS FINE ART FOSSILS THE ISLANDS HISTORICAL PHOTOS MAMMALS OTHER PARKS PLANTS RELIGIOUS REPTILES SCIENCEVIEWS PRINTS
|
Related Documents
Download Options
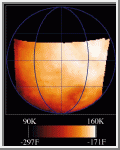
This map shows the temperatures for most of the surface of Ganymede made from data taken by the Photopolarimeter/Radiometer (PPR) instrument on June 26, 1996 as Galileo approached the sunlit side of the moon. The color bar shows the range of temperatures of this data, with the dark red being the coldest and white being the warmest. This is similar to the temperature forecast maps that you see on the evening news or in some newspapers. The difference between this map and one of Earth is that PPR measures the temperature of the surface (the ground), instead of air temperature. Ganymede is much colder than Earth, with these daytime temperatures ranging across the surface from 90 to 160 Kelvin (or -297 to -171 degrees Fahrenheit). Jupiter and its moons receive less than 1/30th the amount of sunlight that the Earth does, and Ganymede has essentially no atmosphere to trap heat. Ganymede's day is just over 7 Earth days long, the same time it takes to orbit Jupiter once. |
